StockMaster
Australia Leading Portfolio Management Software
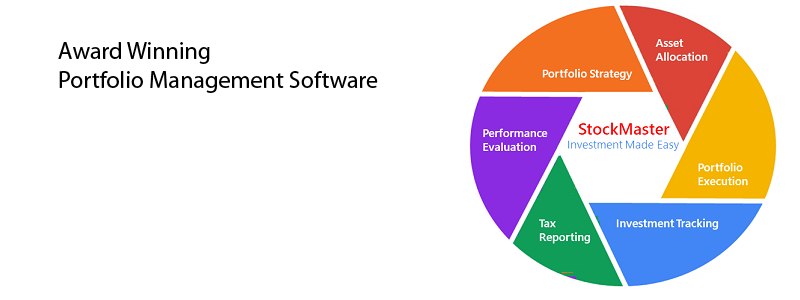
Overview
StockMaster (also branded as StockMarket Plus) has a rich history dating back to 1996 when it was first developed. Over the years, it has grown to become a leading and best-selling portfolio management software in Australia. It is ideal for investors who seek to manage their investments with ease and generate tax reports.
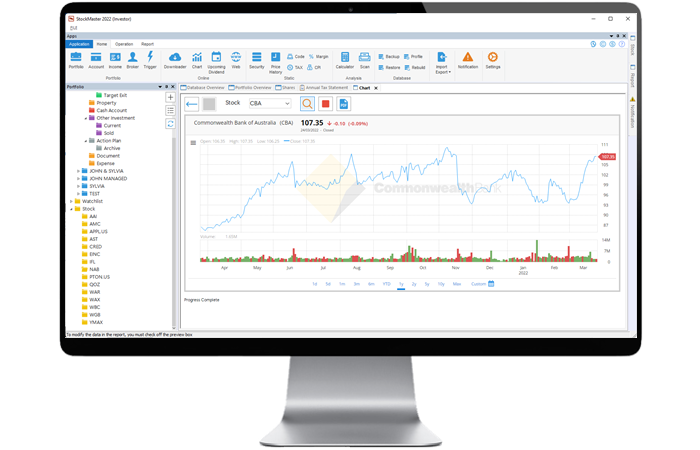
One of StockMaster's unique features is its trade record system, which enables investors to easily record and report trade activities and dividends in a portfolio. The software's online charting and query system makes it easy to plot and perform ad-hoc queries on shares on the fly.
Beyond its core portfolio management capabilities, StockMaster also includes a cash book and property management functionality. This allows investors to track their daily cash transactions and income and expenses for their investment properties, making it a complete investment management package.
Portfolio Management
- Local or Foreign Shares
- Managed Funds
- Fixed Interests
- Property
- Other Investments
- Cash/Trading Accounts
- Asset Allocation
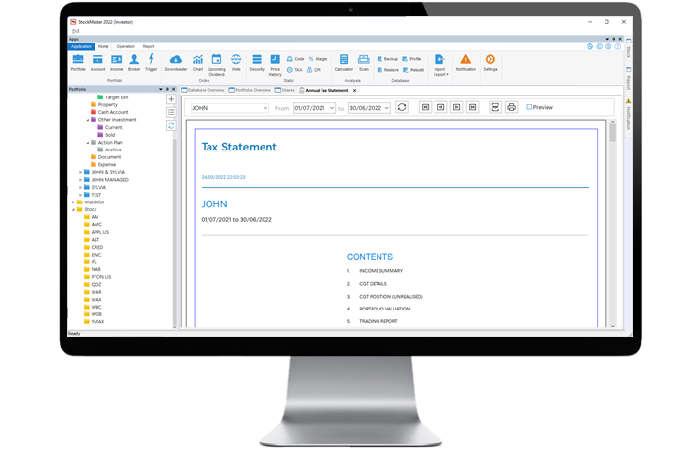
Professional Reports
- Annual Tax Statement
- CGT
- Performance
- Income
- Cashflow Projection
Features
Complete Tracking
Real time tracking your local and foreign shares, managed funds, warrants, options, CFD, fixed interests..etc.
Professional Reports
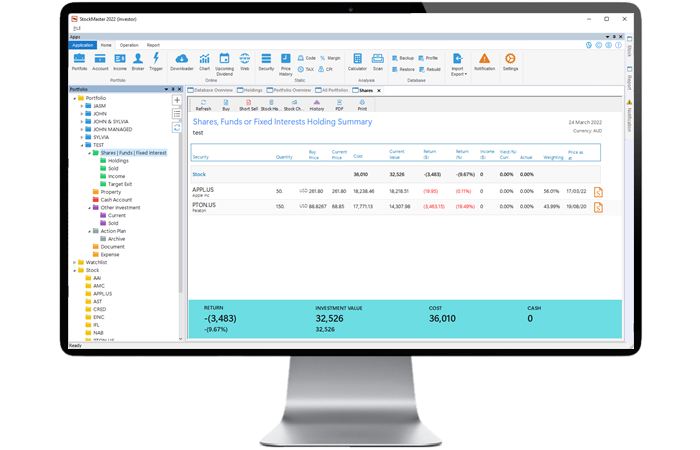
Over 50 professional reports (eg. Capital Gain/Loss, Annual Tax, Transaction, Brokerage, Holdings, Cashflow, performance and income reports...)
Portfolio History
Back track your portfolio holding to see what was your holding as at any particular date.
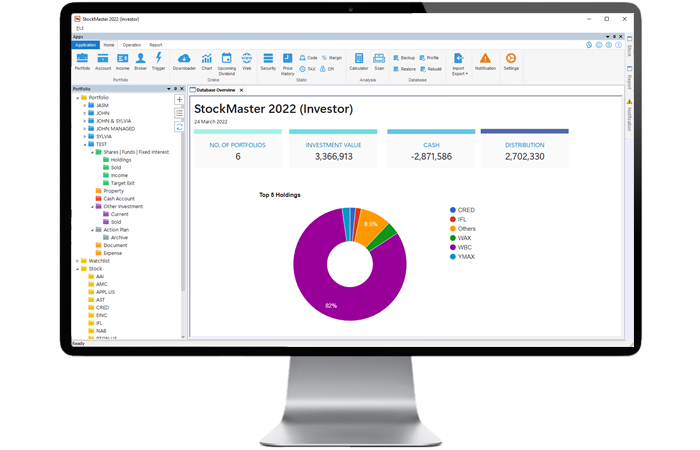
Improve Analysis
Project your dividend income cashflow and imputation credit in next 12 months, top 5 holdings and asset allocation in your portfolios
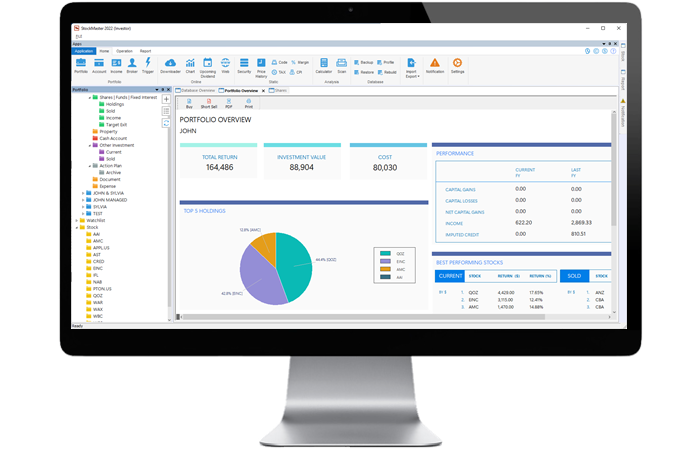
Performance Monitoring
Monitor the preformance and movement of your portfolio over a financial year or any specific period.
Automation
Automatic brokerage calculation, stock trigger alerts, select the discount or imputation methods to lower your capital gains tax.
Trading Practice
Set up target exit and cut loss price. Record portfolio strategy and investment decision
Secured Database
One single secured database file is used and stored in your own computer rather than online service. Though you can store your database in any cloud drive or USB memory stick. You are in control!
Easy Data Update
One click update your portfolio with latest stock price. Import your existing transactions from our Excel templates or online brokers.
Editions
| Free | Beginner | Investor | Professional | |
|---|---|---|---|---|
| Portfolios | 1 | 2 | 5 | Unlimited |
| Stock holdings | 5 | 20 | 50 | Unlimited |
| Cash accounts | 1 | 10 | 50 | Unlimited |
| Reports | 6 | 14 | 20 | All |
| Investment management | ||||
| Cashflow projection | ||||
| EOFY price data | ||||
| Upcoming dividends | ||||
| Live price data | ||||
| EOD price data | ||||
| Historical price data | ||||
| Online charting | ||||
| Client module | ||||
| Consolidated reporting per client | ||||
| Asset Allocation | ||||
| Networking and multi-users access | ||||
| Pricing | $0 pa | $275 pa | $550 pa | $880 pa |
Specification
Current Version
Pricing
Get Started
This software is targeted for:
System Requirements:
This software can also be run on Apple computer via dual boot or window emulation software such as VMWare or Parrallel.
Reviews


StockMaster is ideal for both novice and experienced investors who require a package to keep track of their stock market investments... Seldom does a software package completely outclass competitors, offering users a clearly superior product in terms of sophistication, simplicity and obvious attention to details...
Christian Townsend, Personal Investment Magazine
StockMaster is specifically designed for monitoring a share portfolio and has the added advantage of providing analytical tools as well as keeping the records you need... there is an on-line help facility, which makes the price tag good value if you are active enough in the share market to get full value from the program.
Annette Sampson, Sydney Morning Herald
I used StockMaster for administering my self-managed super fund after an extensive review. It allows me to keep an accurate trading journal, thus to gain valuable insight into my trading methods and enable me to have a systematic review process.
Allen C., Trustee for a Self Managed Super Fund
I am a full time stock trader. Stockmaster has a specially designed backend database. This gives me an unlimited number of transactions per portfolio. It enables me to build a real time trading history of my performance. Stockmaster gives me an edge to find errors in my trading before they become detrimental to my account.
Joe T., Private Trader